Looking for something?


Posts Tagged ‘Times Square’

Well, the start of Q4’11 has been really hectic.

Not only were we honored to be participating at the Robin Hood event with Black Eyed Peas in Central Park, but we were also chosen to be the interactive social platform behind a launch campaign for South Park’s new series which kicked off yesterday in New York’s Times Square.

Times Square visitors could create a South Park avatar of themselves at an interactive kiosk, and then see their avatar displayed live alongside real time tweets (hashtagged SOUTHPARK) on the famous MTV/Viacom screen in Times Square.

And of course, unless you were asleep, yesterday also marked the announcement of the much anticipated iPhone5 ahem iPhone4s.

Place-based social media is ALL ABOUT CAPTURING THE MOMENT AND LETTING THE AUDIENCE ENGAGE, so the last photo in the set here just about sums it up. A tweet proclaims “The iPhone4s killed Kenny”.

Share

Nearly two years ago (Feb 2008), LocaModa launched Jumbli - a mobile and web based word game that was the first cross-channel game to use DOOH and Facebook. Today, Jumbli is still going strong on over 1,000 U.S. bar and cafe screens and in Times Square.

When we launched the game, the first sponsor was AT&T and during their sponsored month, we saw over 300,000 plays and reported that the top “interactive cities” (measured by the percentage of total mobile plays) were: LA 18%, Boston (17%), New York City (17%), and Chicago (10%).

That’s old news - but hang in there… We have Jumbli running on a loop on one of the screens at Loca HQ, and it’s surprising that people are still playing the game (90% via Facebook) from all corners of the world and at all times of the day and night.

Just how much time are the top players spending on Jumbli? As you can see from the above table (click to enlarge), the top player has so far spent the equivalent of 48 days of continuous play!

That’s a lot of time for a word game invented for DOOH screens.

More interesting info on Jumbli can be seen from the Facebook demographic data above (again, click to enlarge) which tells us that outside of USA, Philippines is the top country, then UK. And the top cities are Makati Quezon City and Jakarta, followed by New York. Well that was unexpected!

By the way - KenRandall, ranked #9 in the Jumbli top 10, is my Dad, and now I know he spends way too much time most mornings (from London) being distracted by Jumbli. 28 days to be precise!

Share

Yesterday, I addressed the difficulty in pinning down metrics for place-based cross-channel campaigns like Vans Be Here.

We can all agree that we’re scrabbling on slippery ground when it comes to crunching numbers. So what do we do about it?

First, locate the reward.

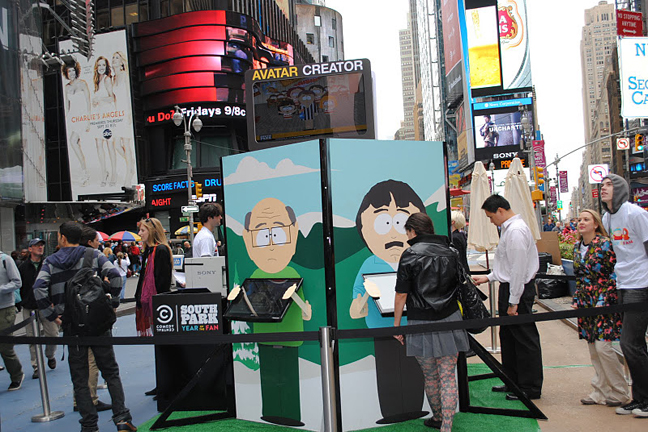
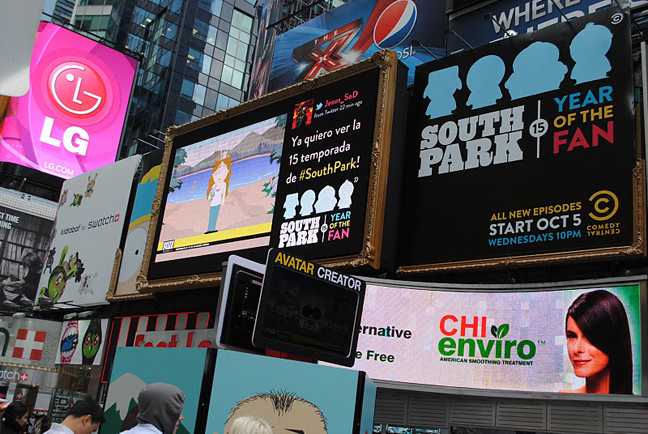
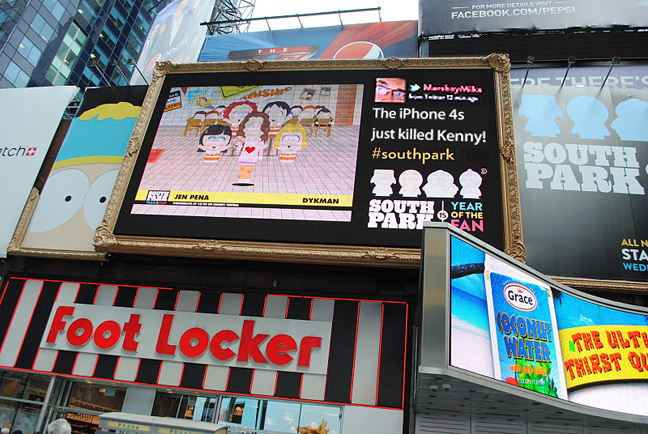
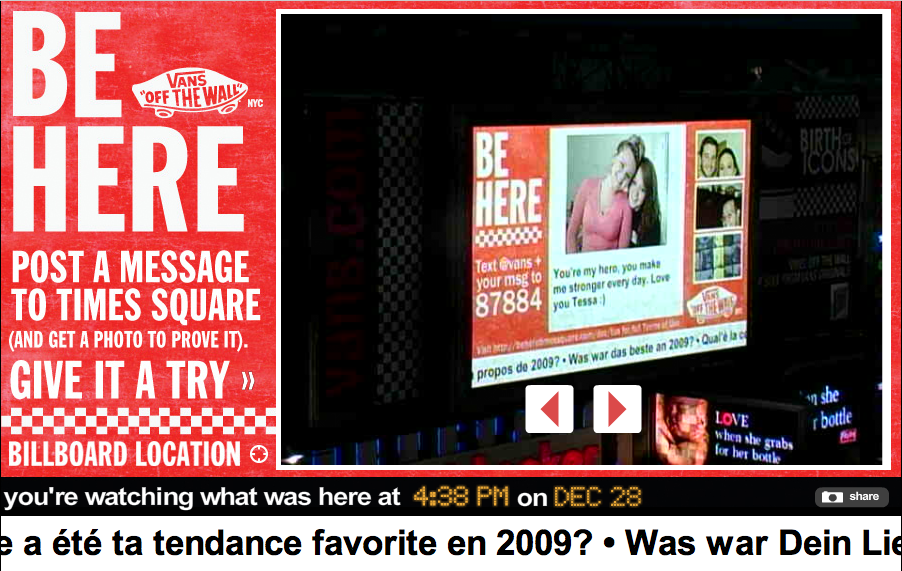
For this campaign, the real payoff for the user is grabbing a snapshot of their photo (or text message) displayed on Viacom’s iconic Jumbotron in Times Square and sharing it with friends.

Now make this step as simple as possible for the user. (In this example, we send them an email with a direct link to their ‘moment,’ and we allow them to spread the photo with a single click.)

Direct Link:
direct link

Upon clicking the “Snapshot” button:

snapshot

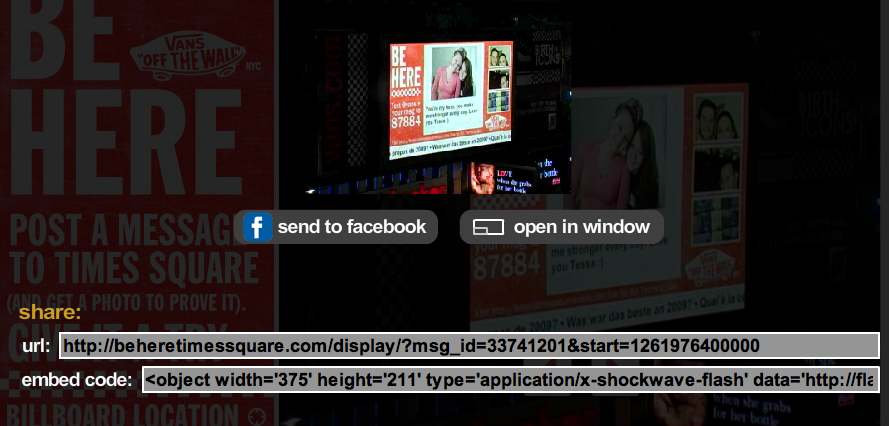
But, what is this interaction exactly?
How do we account for this?; rather, how do we ‘count’ this?

Well, the tricky thing is that this interaction starts with a unique user’s single click, but the real fruit falls when the snapshot is shared. For simplicity’s sake, let’s say the average # of connections for this one user is 126 (the current average # of followers for Twitter users, which seems fair in respect to The Dunbar Number).

So does this count as 1 click and 126 impressions?
Not quite.

What about the out-of-home component? How many eyeballs saw this photo in Times Square? How many people did it affect (passively, subconsciously)?; How many were actually stirred to effect (actively sending in their photo, too)?

Well, if we take into consideration that 1.6 million people pass through Times Square each day (and 500,000 gather there on NYE), then we’ve clearly thrown an exponent into the mix here (though actual computations here are flimsy at best). [src]

A campaign like this must be understood as tracking ‘interaction bundles’ rather than simply impressions or clicks (at the risk of muddying the already murky waters of digital out-of-home vocabulary). The only way to give meaning to numbers here is to qualify rather than quantify:

* Define your verbs (click, txt, view, visit, watch, write, submit, photograph, playback, share, embed)
* Assign worth (find the ‘fruit’)
* Construct goals around collecting as much of this fruit as possible (in this case, getting as many users as possible to share their image with their friends).

Not done yet.

Now calculate the out-of-home spreadability and brand identification piece that’s happening here on a much larger scale than any subset of active users could ever proliferate (no matter how much you subscribe to The Law of the Few).

We end up with a results overview that should remain focused on the brand awareness component, but should also give due credence to the rich ‘interaction bundles’ of the superuser (one who actually employs at least three of these verbs- e.g. visits the site, sees the billboard, sends in content, gets a snapshot, and shares among his social graph).

Have I made you nostalgic for the days of banner ads yet?

Share

Share

It’s been quite the year for Jumbli! It became one of the first 100 verified Facebook apps, took off in popularity on the Times Square Jumbotron (hitting 5.8 plays per second!), launched as an iPhone app on iTunes, found a very devoted audience both online and in bars and restaurants, and even spurred the creation of a Jumbli Addicts support group!

Here’s to another year of growing audiences and engaged addicts players!

Share